Important
This is a blog post series. If you haven’t read Part 1 we recommend you to do so first!
In the first blog post, we learned about the fantastic symbols (debug symbols), how the symbolization process works and lastly, how to find the symbolic names of addresses in a compiled binary.
The actual location of the symbolic information depends on the programming language implementation the program is written in. We can categorize the programming language implementations into three groups: compiled languages (with or without a runtime), interpreted languages, and JIT-compiled languages.
In this post, we will continue our journey to find fantastic symbols. And we will look into where to find them for the other types of programming language implementations.
JIT-compiled language implementations
Examples of JIT-compiled languages include Java, .NET, Erlang, JavaScript (Node.js) and many others.
Just-In-Time compiled languages compile the source code into bytecode, which is then compiled into machine code at runtime, often using direct feedback from runtime to guide compiler optimizations on the fly.
Because functions are compiled on the fly, there is no pre-built, discoverable symbol table in any object files. Instead, the symbol table is created on the fly. The symbol mappings (location to symbol) are usually stored in the memory of the runtime or virtual machine and used for rendering human-readable stack traces when it is needed , e. g. when an exception occurs, the runtime will use the symbol mappings to render a human-readable stack trace.
The good thing is that most of the runtimes provide supplemental symbol mappings for the just-in-time compiled code for Linux to use perf.
perf defines an interface to resolve symbols for dynamically generated code by a JIT compiler.
These files usually can be found in /tmp/perf-$PID.map, where $PID is the process ID of the process of the runtime that is running on the system.
The runtimes usually don’t enable providing symbol mappings by default. You might need to change a configuration, run the virtual machine with a specific flag/environment variable or run an additional program to obtain these mappings. For example, JVM needs an agent to provide supplemental symbol mapping files, called perf-map-agent.
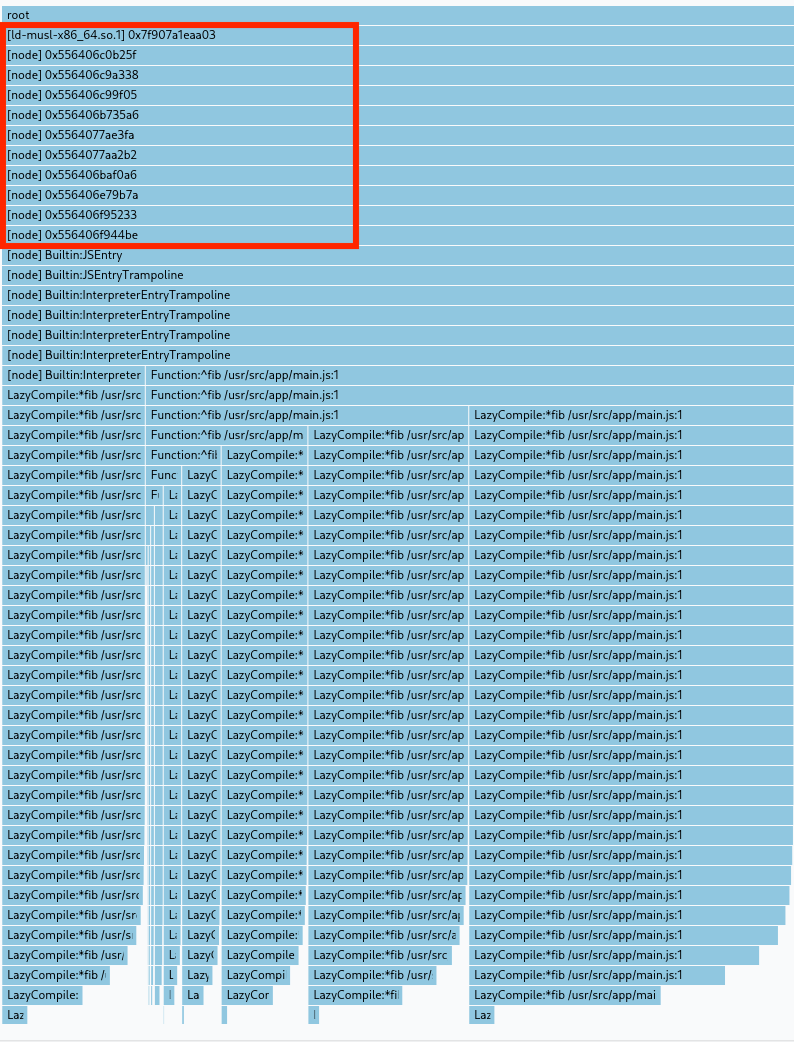
Let’s see an example perf map file for NodeJS. The runtimes out there output this file with more or less the same format, more or less!
To generate a similar file for Node.js, we need to run node with --perf-basic-prof option.
| |
This will create a map file at /tmp/perf-<pid>.map that looks like this:
| |
Each line has
START,SIZEandsymbolnamefields, separated with spaces.STARTandSIZEare hex numbers without 0x.symbolnameis the rest of the line, so it could contain special characters.
With the help of this mapping file, we have everything we need to symbolize the addresses in the stack trace. Of course, as always, this is just an oversimplification.
For example, these mappings might change as the runtime decides to recompile the bytecode. So we need to keep an eye on these files and keep track of the changes to resolve the address correctly with their most recent mapping.
Each runtime and virtual machine has its peculiarities that we need to adapt. But those are out of the scope of this post.
Interpreted language implementations
Examples of interpreted languages include Python, Ruby, and again many others. There are also languages that commonly use interpretation as a stage before JIT compilation, e. g. Java. Symbolization for this stage of compilation is similar to interpreted languages.
Interpreted language runtimes do not compile the program to machine code. Instead, interpreters and virtual machines parse and execute the source code using their REPL routines. Or execute their own virtual processor. So they have their own way of executing functions and managing stacks.
If you observe (profile or debug) these runtimes using something like perf,
you will see symbols for the runtime. However, you won’t see the language-level context you might be expecting.
Moreover, the interpreter itself is probably written in a more low-level language like C or C++. And when you inspect the object file of the runtime/interpreter, the symbol table that you would find would show the internals of the interpreter, not the symbols from the provided source code.
Finding the symbols for our runtime
The runtime symbols are useful because they allow you to see the internal routines of the interpreter. e. g. how much time your program spends on garbage collection. And it’s mostly like the stack traces you would see in the debugger or profiler will have calls to the internals of the runtime. So these symbols are also helpful for debugging.
Warning
Most of the runtimes are compiled with
productionmode, and they most likely lack the debug symbols in their release binaries. You might need to manually compile your runtime indebug modeto actually have them in the resulting binary. Some runtimes, such as Node.js, already have them in theirproductiondistributions.
Lastly, to completely resolve the stack traces of the runtime, we might need to obtain the debug information for the linked libraries.
If you remember from the first blog post, debuginfo files can help us.
Debuginfo files for software packages are available through package managers in Linux distributions.
Usually for an available package called mypackage there exists a mypackage-dbgsym, mypackage-dbg or mypackage-debuginfo package.
There are also public servers that serve debug information.
So we need to find the debuginfo files for the runtime we are using and all the linked libraries.
Finding the symbols for our target program
The symbols that we look for in our own program likely are stored in a memory table that is specific to the runtime.
For example, in Python, the symbol mappings can be accessed using symtable.
As a result, you need to craft a specific routine for each interpreter runtime (in some cases, each version of that runtime) to obtain symbol information. Educated eyes might have already noticed, it’s not an easy undertaking considering the sheer amount of interpreted languages out there. For example, a very well known Ruby profiler, rbspy, generates code for reading internal structs of the Ruby runtime for each version.
If you were to write a general-purpose profiler, like us, you would need to write a special subroutine in your profiler for each runtime that you want to support.
Again, don’t worry, we got you covered
The good news is we got you covered. If you are using Parca Agent, we already do the heavy lifting for you to symbolize captured stack traces.
And we keep extending our support for the different languages and runtimes.
For example, Parca has already support for parsing perf JIT interface to resolve the symbols for collected stack traces.
Check Parca out and let us know what you think, on Discord channel.