Symbolization is a technique that allows you to translate machine memory addresses to human-readable symbol information (symbols).
Why do we need to read what programs do anyways? We usually do not need to translate everything to a human-readable format when things run smoothly. But when things go south, we need to understand what is going on under the hood. Symbolization is needed by introspection tools like debuggers, profilers and core dumps or any other program that needs to trace the execution of another program. While a target program is executing on a machine, these types of programs capture the stack traces of the program that is being executed.
A stack trace (also called stack backtrace or stack traceback) is a report of the active stack frames at a certain point in time during the execution of a program.
In raw stack traces, the addresses of the functions that are being called are recorded. The addresses are hexadecimal numbers representing the memory return addresses of the functions. Symbols are needed to translate memory addresses into function and variable names precisely as in the program’s source code to be read by us humans. Without symbols, all we see are hexadecimal numbers representing the memory addresses that we have captured.

It sounds simple enough, right? Well, it’s not. As with everything else about computers, it’s a bit of sorcery. It has its challenges, such as associating them with correct symbols, transforming addresses, and most importantly, actually finding the symbols! The strategies to get symbol information varies depending on the platform and the programming language implementation that the program is written in.
For the sake of simplicity, we will be focusing on Linux as the target platform and ignore Windows, macOS and many other platforms. Otherwise, I could end up writing a small size book in here :)
Fantastic Symbols …
A symbol (or debug symbol, to be precise) is a special kind of symbol that attaches additional information to the symbol table of a program. This symbol information allows a debugger or a profiler to gain access to information from the program’s source code, such as the names of identifiers, including variables and functions. But where can we find these symbols?
… and Where to Find Them
The actual location of the symbolic information depends on the programming language implementation the program is written in. We can categorize the programming language implementations into three groups: compiled languages (with or without a runtime), interpreted languages, and JIT-compiled languages.
If the program is a compiled one, these may be compiled together with the binary file, distributed in a separate file, or discarded during the compilation and/or linking. Or, if the program is interpreted, these may be stored in the program itself. Let’s briefly look at where and how we can find these symbols depending on the programming language implementation.
Compiled language implementations
Examples of compiled languages include C, C++, Go, Rust and many others.
The compiled languages usually have a symbol table that contains all the symbols used in the program. The symbol table is usually compiled in the executable binary file. And the binary file is typically in the ELF format (for Linux systems). Symbol tables are included in the ELF binary file, specifically for mapping the addresses to function names and object names. In rare cases, it is stored in a separate file, usually with the same name as the binary file, but with a different extension.

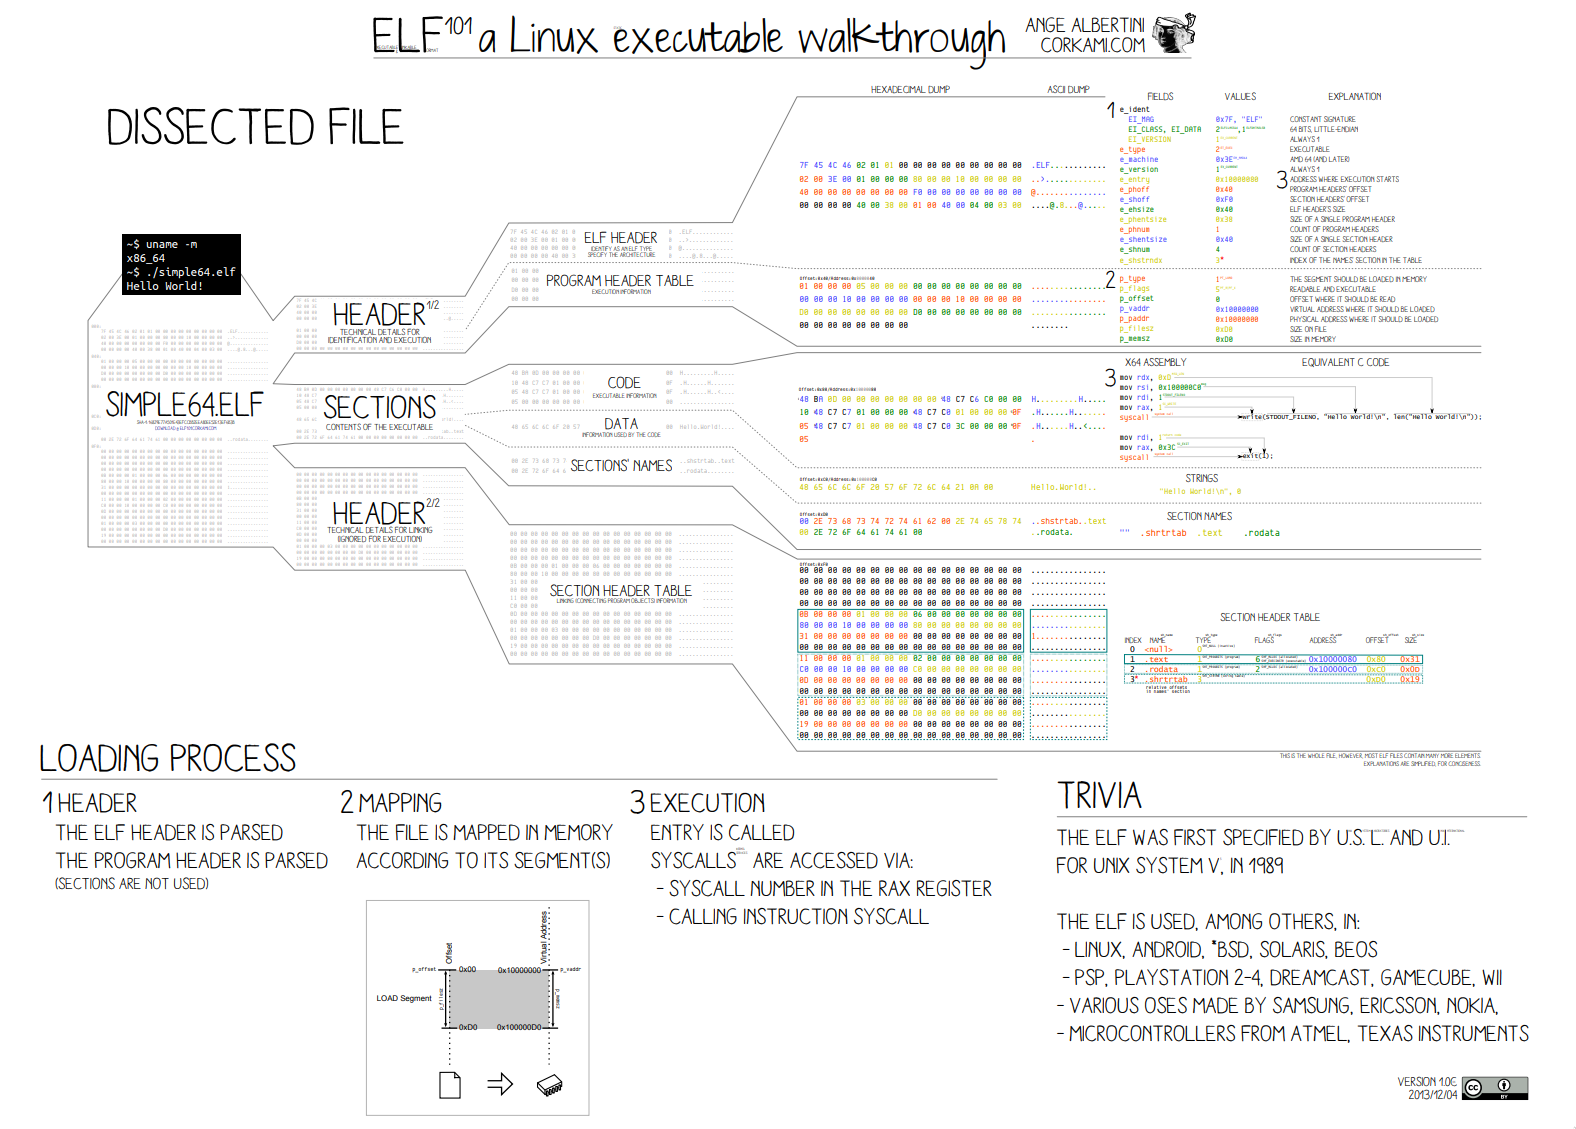
The ELF format is not an easy one to describe in a couple of sentences. For the purpose of this article, we will focus on what we need to know about the ELF format.
Each ELF file is made up of one ELF header, followed by file data. The ELF header is a fixed size and contains information about the data sections.
The relevant part for us is the symbols can live in a special section called .symtab and .dynsym.
.dynsym is the “dynamic symbol table” and it is a smaller version of the .symtab that only contains global symbols.
Contents of .dynsym and .symtab section using readelf -s /bin/go:
| |
Go has a unique table (of course). It stores its symbols in a section called
.gopclntab. This is a table of functions, line numbers and addresses. Go does this because it needs to be able to render human-readable stack traces when a panic occurs in runtime;
Note that addresses in the symbol table do not move during execution so that they can be read any time during the execution of the program. They can easily be loaded into memory independent of the running program and an observer can easily read them.
We assumed that the binary file is a statically linked executable until this point. However, this might not be the case. The binary file might be dynamically linked to other libraries. From now on, we will refer to these shared library files and executables (both in ELF format) as object files. Each object file can have its own symbol table.
We need to note that when we take a snapshot of the stack (a.k.a stack trace), it could include addresses from linked shared libraries and Kernel functions.
Kernel-level software differs as it has its own dynamic symbol table in
/proc/kallsyms, which is a file that contains all the symbols that are used in the kernel. And it can grow as the kernel modules are loaded.
We can read the object files by using binary utilities such as objdump, readelf and nm.
To read the .symtab:
| |
To read the .dynsym:
| |
For the compiled languages, the symbol table is not the only source of symbols. There are also DWARFs!
Debuginfo
ELFs and DWARFs, welcome to fairyland.
Another way to obtain the symbols from an object file is to use the debug information or debuginfo in short.
Same as the symbol table, this information can be compiled in the binary file, formatted in the DWARF(Debugging With Attributed Record Formats) or in a separate file.
DWARF is the debug information format most commonly used with ELF. It’s not necessarily tied to ELF, but the two were developed in tandem and work very well together.
This information is split across different ELF sections (.debug_* and .zdebug_* for compressed ones), each with its own piece of information to relay.
For our specific needs, we need to use the .debug_info section to find corresponding functions and .debug_line section to corresponding line numbers.
Debuginfo files for software packages are available through package managers in Linux distributions.
Usually for an available package called mypackage there exists a mypackage-dbgsym, mypackage-dbg or mypackage-debuginfo package.
There are also public servers that serve debug information.
One Program to bring them all, and in the darkness bind them: addr2line
Wait, what?! Isn’t that from another fantasy book?
Now that we have the symbol table or debug information, we can use addr2line (address to line) to get the source code location of a given address.
addr2line converts addresses back to function and line numbers.
Let’s see it in action addr2line -a 0x0000000000001154 -e <objectFile>:
For addr2line <objectFile> can be any object file compiled with debug information or symbols. It can be an executable, a shared library or output of a strip operation.
Voilà!
| |
I used a simple C executable for this example. And we have got our symbol and attached source information for the corresponding address 🎉

I only wish we had compiled programming language implementations out there, then our job here could have been finished. But we are not. We need to keep digging. But for that, you need to wait for another week. As we hinted at in the title of this post, there will be a part 2! All the best franchises are sequels, right?! In part 2, we will see how interpreted languages and Just-In-Time compiled languages handle symbols.
Please stay tuned!
Don’t worry we got you covered
Even though we simplified things a bit here, if you want to write a program to utilize symbolization, you still have a lot of work to do.
Many open-source tools out there already handle nitty-gritty details of symbolization, like perf.
The good news is we got you covered. If you are using Parca Agent, we already do the heavy lifting for you to symbolize captured stack traces. And we keep extending our support for the different languages and runtimes.
Check Parca out and let us know what you think, on Discord channel.
Further reading
- https://en.wikipedia.org/wiki/Debug_symbol
- https://www.brendangregg.com/bpf-performance-tools-book.html
- https://github.com/DataDog/go-profiler-notes/blob/main/stack-traces.md
- https://www.brendangregg.com/perf.html
- https://jvns.ca/blog/2018/01/09/resolving-symbol-addresses/