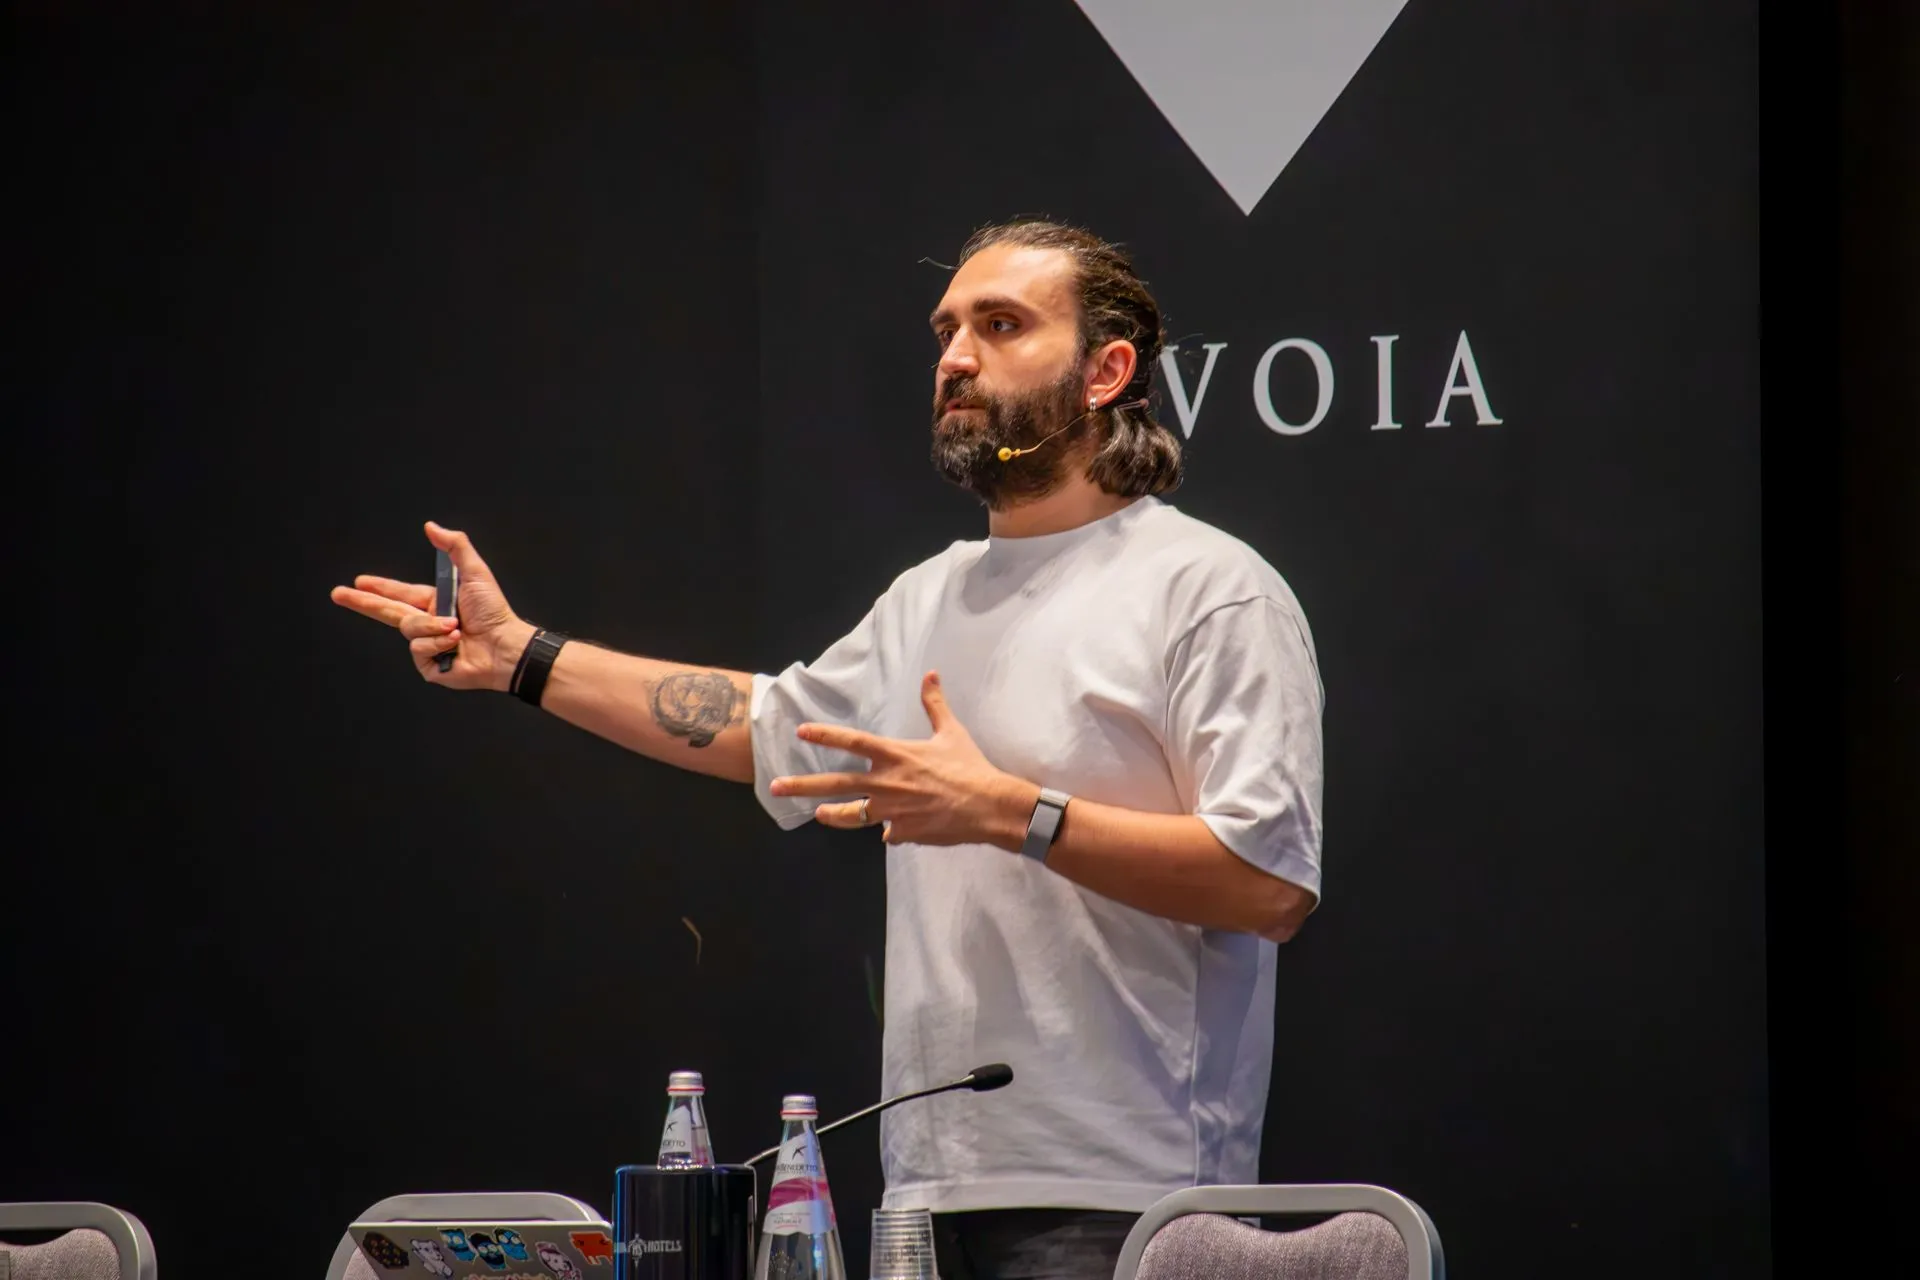
A production bug, a service you cannot touch, and a debugging loop measured in deploys. This talk follows one Go process through its lifecycle and finds an instrumentation point at each station: at build time, at process start, and in the kernel.
At build time, otelc rewrites the code during compilation, so the binary ships already instrumented. At process start, the OpenTelemetry injector loads an agent into the process without a rebuild. In the kernel, OBI attaches eBPF probes to a static Go binary and collects traces and metrics from outside the process. Along the way we pick up CPU profiles, see where request correlation across goroutines and connections breaks down, and when the baseline still cannot answer the question, a live debugging probe captures the missing logs and variables within explicit limits.
Zero-touch does not mean zero operational cost. Build-time instrumentation still needs a rebuild, injection needs a compatible loader, and eBPF needs privileges and platform support. The closing sections carry four asks for the Go team, from goroutine-local storage to USDT probes, and the decision table that picks the layer your constraints still allow. Then the talk returns to the opening bug: an agent can close the loop once the evidence is there to act on.
Slides
Links
- golab-26 — both decks, speaker notes, and research
- public-content — the talk archive; this deck is indexed there
- zeroins — the
obi-integration,otelc-aspect,kubectl-obi, andkubectl-profilercommands
Events
- GoLab 2026 — Monday 2 November 2026, 15:30, room Golab #1
Related
- Instrument Go Without Changing a Single Line — the GopherCon UK 2026 version, with recording
- Why Your Go Benchmarks Are Lying (And How to Stop Them) — the second talk, plugged at the end of this one
- Auto-Instrumenting Go: From eBPF to USDT Probes — full technical blog post expanding on this talk
- Hooking into the Go Toolchain —
-toolexecfrom a stopwatch to otelc, a guest post on Internals for Interns