From talk to docs: The Zen of Prometheus
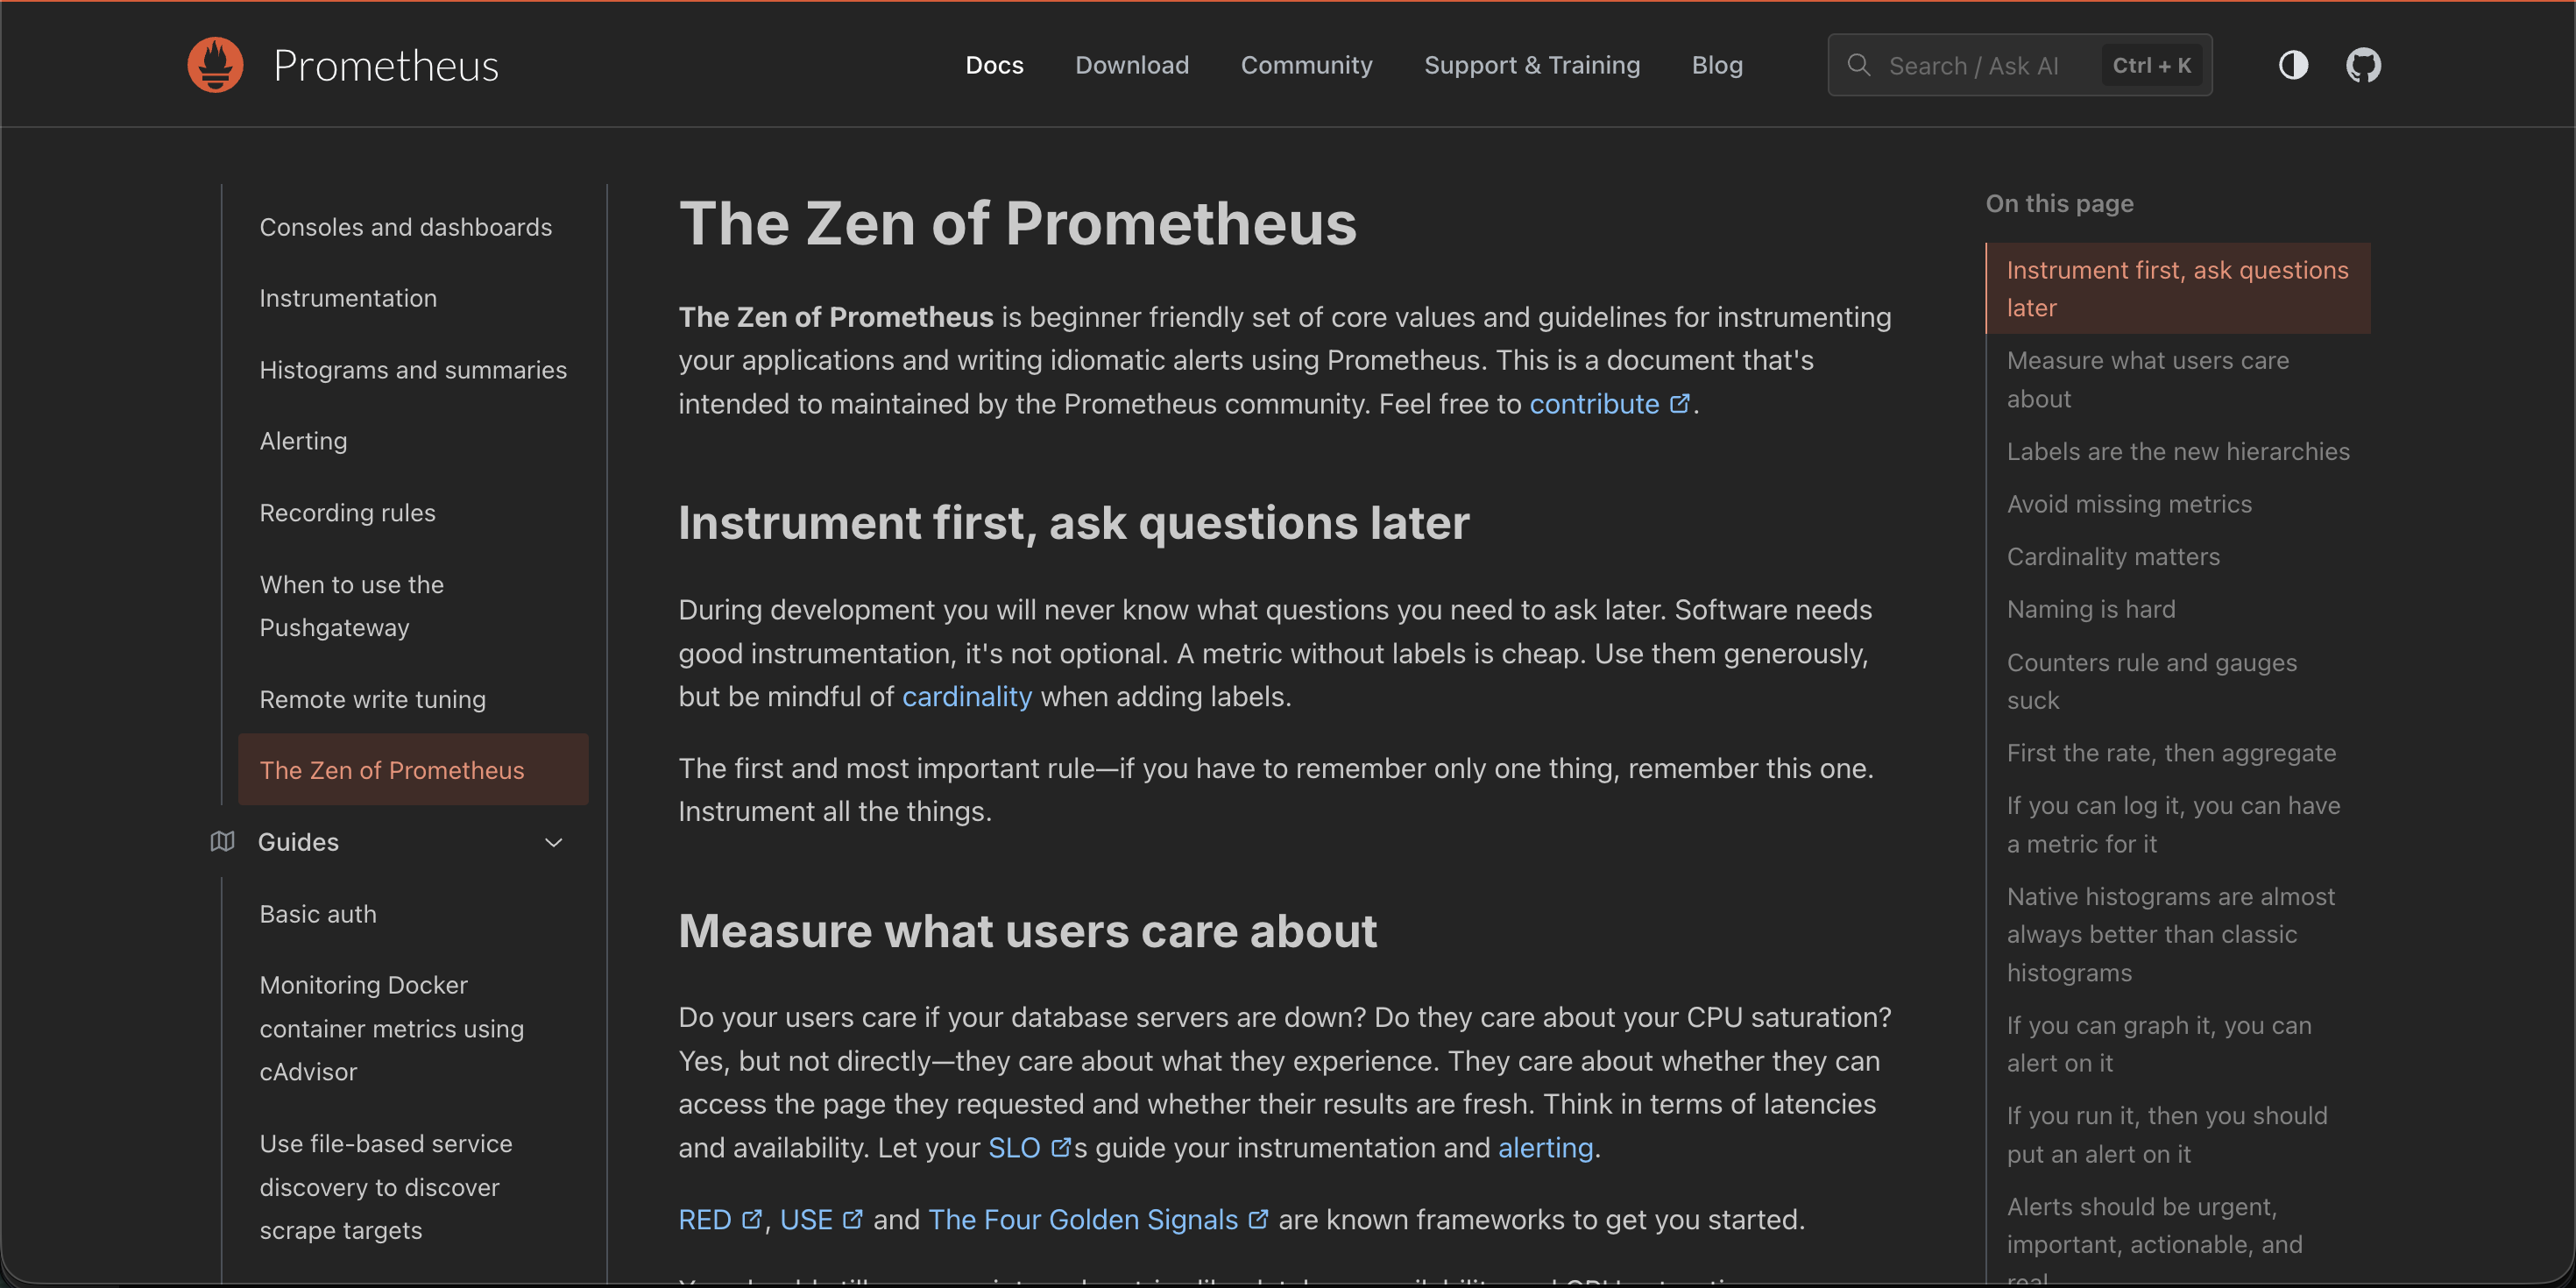
Every now and then a project surprises you by remembering something you said years ago. This week was one of those weeks. A talk I gave at PromCon Online 2020 — The Zen of Prometheus — has quietly become part of the official Prometheus documentation. I am still sitting with it. Where it started The talk was born in the strangest year of my career. PromCon 2020 was online, like everything else. I was a few years deep into running Prometheus in anger, collecting scars from instrumenting services that didn’t want to be instrumented and writing alerts that kept me up at night for the wrong reasons. I wanted a way to package those lessons that wasn’t another forty-slide deck of bullet points. ...