Talks · · 1 min
talk: How to Instrument Go Without Changing a Single Line of Code
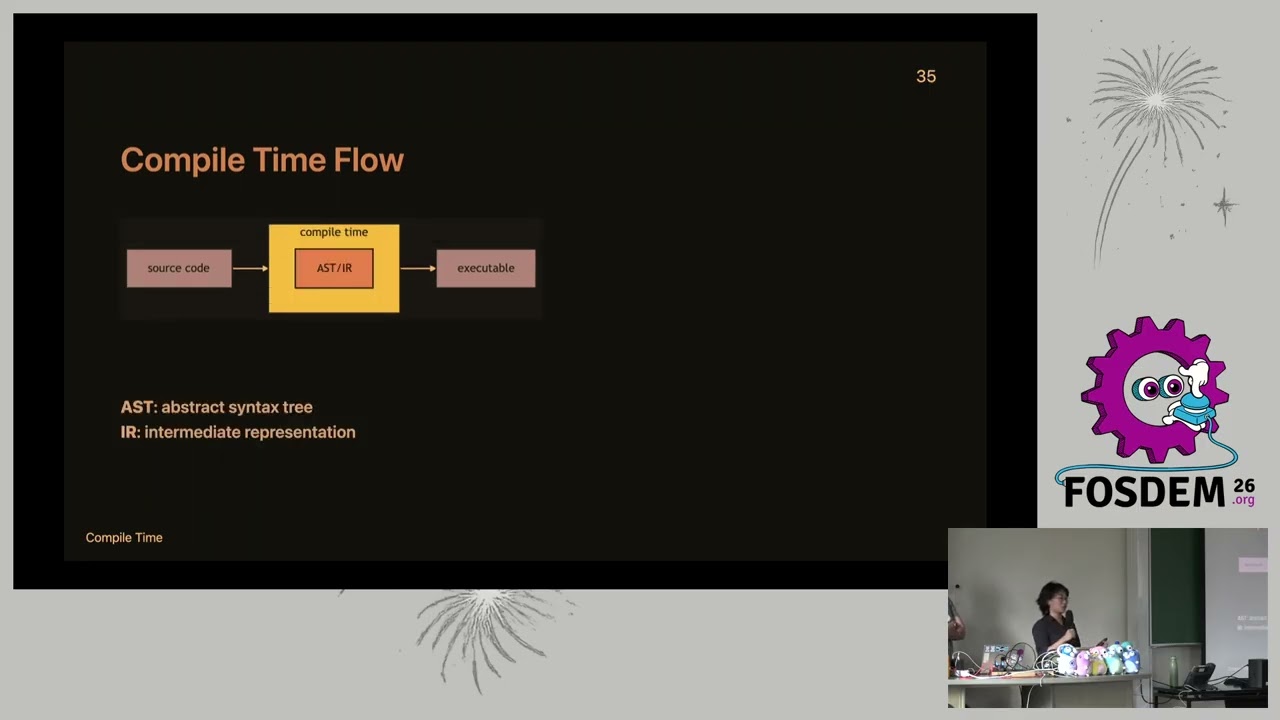
Zero-touch observability for Go is finally becoming real. In this talk, we walk through the different strategies you can use to instrument Go applications without changing a single line of code, and what they cost you in terms of overhead, stability, and security. We compare several concrete approaches and projects: eBPF-based auto-instrumentation using OpenTelemetry’s Go auto-instrumentation agent and OBI (OpenTelemetry eBPF Instrumentation), compile-time manipulation using tools like Orchestrion and the OpenTelemetry Compile-Time Instrumentation SIG, runtime injection via Frida/ptrace, and USDT (User Statically-Defined Tracing) probes — both via libstapsdt and a custom Go runtime fork. ...